User:Huhhila
Jump to navigation
Jump to search
Special:Whatlinkshere/User:Huhhila
Lorem ipsum.
Random patches
Slats
From 608fd6fad26ccf1b2515bfb897cdee63e72ceae5 Mon Sep 17 00:00:00 2001
From: Huhhila <huhhila@example.org>
Date: Sun, 12 Jan 2025 10:02:52 +0200
Subject: [PATCH] Fix transparency.

---
 api.lua | 1 +
 1 file changed, 1 insertion(+)

diff --git a/api.lua b/api.lua
index 65e19bd..a41c8b2 100644
--- a/api.lua
+++ b/api.lua
@@ -57,6 +57,7 @@ function slats.register(subname, opts)
 		paramtype2 = "wallmounted",
 		is_ground_content = false,
 		sunlight_propagates = true,
+		use_texture_alpha = "clip",
 		groups = opts.groups,
 		sounds = opts.sounds,
 		node_box = {
--
2.43.0
H4sIAF13g2cEA0VQXWvcMBB8Pv2KJU8JPru2crYvpi1XWo5QKBQub6GYtby2VXSy0Ad1aH985DvS gFh2dzQzu3u08xmqfD/01YA9r4QYio6XRdkN3f6hFj1RdU81F4RUwo9Zw4kMFDXkeXN5wPO8YMco 08BjmCapED5O1+RAC56Nomy242f2DT01cAp6CwWH76gjlZdQRCHelBySPEqxU+h+k/ANPP/88vT1 8Rcc5QLeonYGLWnxkjGWpikDNDJTAeEfFJCwGAapCMSEeqQ+WoDUjqyXs75N7hjr5TBAmo7SA354 43ZvGZO6pwWqkoqHrs8y3BVi3/E4XF7tdqvhO4slSQLvzMMB0rLeVpDEWEMsh6DF6gtOoXeZpVE6 T/bWhU7jmbYwG+/uGGw2cSU8+xdDHD7BzR9U6jwH7am/2a6wdO1oY6NvxRy72sdfAypHF9QFreQ4 +dbY2eAYr+si7m2IcLLZBEetp8UHSy0qM+FqIZQ0V+1V2KyEdZjsWl1lV8P/gLtUF0DPPbXdvETO 33gRYDzb3Wc5Y69xYKfLRAIAAA== |

Misc
Discrete/voxel iterator over the volume between two spatial vectors, inclusive (WIP):
local function iter (a, i)
  local x, y, r = a.x, a.y, a.r
  local z
  x = x + (i % r.x)
  y = y + (math.floor(i/r.x) % r.y)
  z = math.floor(i/r.x/r.y)
  if z >= r.z then
    return nil
  end
  z = a.z + z
  i = i + 1
  -- TODO: Unroll all the / and % out from here?
  return i, vector.new(x, y, z)
end

function vipairs (v1, v2)
  local v = vector.copy(v1)
  v.r = vector.offset(vector.subtract(v2, v1), 1, 1, 1)
  return iter, v, 0
end


-- usage examples:
for i, v in vipairs(vector.new(-1, -1, -1), vector.new(1, 1, 1)) do
  -- do something at each of the 27 example coordinates
end

for i, v in vipairs(vector.new(-1, -1, -1), vector.new(1, 2, 3)) do
  -- do something at each of the 60 example coordinates
end
Looking for a FOSS licensed alternative to highchartsgpt.
An example to try with that particular tool:
- Create chart with the following example data (unix timestamp and discrete stepped measurement) and moving averages (excluding over 3 minutes of 0); if a measurement interval in that exceeds three minutes, add synthetic value of 0 at 3 minutes after the latest measurement and 0. In case of duplicates, also add one millisecond to the value:
1710974308:72000
1710974422:72000
1710974479:66000
1710974479:66000
1710974483:72000
1710974603:72000
1710974652:60000
1710974653:60000
1710974654:48000
1710974656:60000
1710974657:66000
1710974658:72000
1710974783:72000
1710974828:60000
1710974828:60000
1710974831:54000
1710974834:60000
1710974835:72000
1710975013:0
1710975014:0
1710975018:24000
1710975019:48000
1710975020:72000
1710977201:0
1710977201:0
1710977205:24000
1710977206:48000
1710977207:72000
1710977322:72000
1710977380:66000
1710977380:66000
1710977381:60000
1710977385:66000
1710977386:72000
1710977502:72000
(sometimes triggers ratelimits in their public demo endpoints even with that little demo data, sometimes doesn't)
Various oddities

Underground sunlight with liquids at mapchunk edge.
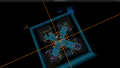
Liquids at mapgen edge, lights added with digibuilders.
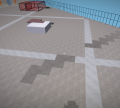
Dynamic colored shadows resulting in Moiré slabs.

Skybox as dungeon chest xray-vision.


